Analytics come with every plan, beside your scheduler and inbox
A social media analytics tool for every post, channel and campaign you run
Viraly reads the numbers from ten social networks and shows them at three levels, the post, the channel and the campaign across networks, on every plan. You keep up to two years of history, export CSV and PDF reports your clients can read as they are, and ask the assistant what your best post did instead of digging through tabs.
- Post, channel and campaign analytics come with every plan, Free too
- History reaches two years on Agency and Enterprise
- Reports export as CSV and PDF, with a white label PDF on Enterprise
- PostTop post this week
Thursday's Reel, the 30 second treatment tour
2,140 views186 likes64 saves - Channel
Instagram, Mateo's Treatments
+212 followers18,400 viewsBest hour: 11:00 - CampaignYouTube is counted on its own
Autumn skin series on three networks
9 posts41,200 views1,860 reactions
Viraly fetched these numbers again this morning.
This is the shape of the three levels in one social set, with sample numbers.
Three levels
Three levels: the post, the channel, the campaign
Social media analytics software earns its place when the number sits at the level where you make the decision. Viraly reports at all three levels on every plan, and each level answers a different question.
The post
What did this one do?
Each post gets its own row with likes, comments, shares and saves, and views or impressions where the network reports them. You list the top posts for any period you pick, open one to see what it did, and ask the assistant what your best post this week did.
The channel
How is the account doing?
Followers and the profile's views sit at the channel level where the network reports them, and Facebook and Instagram add a daily series of follows and unfollows that reaches back as far as your plan keeps. Best times come from your own data here: Viraly works out the hours and days that did best for each channel from your own posts, not from a generic chart.
The campaign
Did the launch work across networks?
Campaign analytics put the posts from one campaign across networks side by side and add them up, so a launch that ran on Instagram, LinkedIn and TikTok gets one total instead of three tabs. YouTube is the exception: its numbers stay out of combined totals under YouTube's Developer Policies, so Viraly shows them on their own.
The free engagement rate calculator does the same math by hand for one post, and the per-network pages below show what each network reports.
By plan
History by plan
Every plan keeps the same three levels. What changes by plan is how far back the numbers reach, and the pricing page has the plans side by side.
- Plan 1 of 5
Free
2 weeks
Two weeks is enough to read last week against the week before.
- Plan 2 of 5
Influencer
6 months
Half a year lets a campaign be read against the months before it.
- Plan 3 of 5
Business
12 months
A full year puts this month next to the same month last year.
- Plan 4 of 5
Agency
2 years
Two years reads a client's second year against their first.
- Plan 5 of 5
Enterprise
2 years
Two years of history, and the white label PDF carries your branding when you send it.
Viraly fetches each channel's numbers again about every 24 hours, and you can ask for a fresh sync when you need one. Longer history matters most for a monthly social media analytics report, where the same month last year is the fairest comparison.
Compare plansTen networks
Ten networks, each with its own numbers
Each network reports different things, so Viraly shows every one with the metrics that network gives, and each one has its own page. WordPress is the eleventh channel, where the Viraly plugin shares each new blog post to your social channels, and it has no analytics here.
Posts and Reels report reach, likes, comments, saves, shares and plays, and the account reports daily follows and unfollows.
See the Instagram analytics toolPages report reactions of all six types, comments, shares and video views, with follows and unfollows over time.
See the Facebook analytics toolX
Profiles report followers, following and listed count, with verification status.
X comes with Influencer and up.
See the X analytics toolCompany pages report post performance, follower demographics, page views, button clicks and organic against paid followers.
See the LinkedIn analytics toolTikTok
Videos report views, likes, comments and shares, and the account reports followers, following, total likes and video count.
See the TikTok analytics toolYouTube
Channels and videos report views, watch time, likes, comments and subscribers. Under YouTube's Developer Policies, Viraly shows no engagement rate or other derived figure for YouTube and keeps it out of combined totals.
See the YouTube analytics toolPins report impressions, saves, pin clicks and outbound clicks, with insights per board.
See the Pinterest analytics toolThreads
Posts report views, likes, replies and reposts, and the profile reports its followers by country and city.
See the Threads analytics toolBluesky
Posts report likes, replies, reposts and quotes, and starter packs are tracked too.
See the Bluesky analytics toolMastodon
Posts report favorites, boosts and replies, with engagement across instances on the fediverse.
See the Mastodon analytics toolWhat stays out
Viraly shows the figures each network reports and keeps the derived ones honest. YouTube gets no engagement rate and no place in combined totals, because YouTube's Developer Policies do not allow it, and WordPress has no analytics in Viraly because the plugin shares your blog posts to your channels and does not measure.
Reports
Reports your clients can read
A social media reporting tool has to get the numbers out of the app in a form a client will read. Viraly exports them three ways by plan, and two routines, once switched on, add a plain narrative to the numbers each Monday and each month.
CSV export
Export the analytics as a CSV and open it in a spreadsheet, so your own charts and your client's template both start from the same rows.
PDF analytics reports
Export a PDF analytics report and send it as it is. The social media analytics report carries the numbers and the period, so nobody has to rebuild it in a deck.
White label PDF
The PDF carries your logo, your colors and your brand name instead of Viraly's, so a client reads a report from your agency and never sees the tool behind it.
On Influencer and up, switch on the Weekly performance digest routine and every Monday it compares the last 7 days with the 7 before, names the top and worst posts and adds one suggestion for each. It reads only, and it reports inside the app, in the assistant section and the notification bell, not by email.
Switch on the Monthly report routine and on the first of the month it writes the analytics export plus a short narrative per channel and per category for last month. You switch it on per social set, so a client's set gets its own report, shown inside the app rather than sent to an inbox.
Agencies that send reports under their own name find the rest of the white label setup on the white label page, and approvals for the posts behind the numbers live on the approvals page.
The assistant
Ask instead of digging
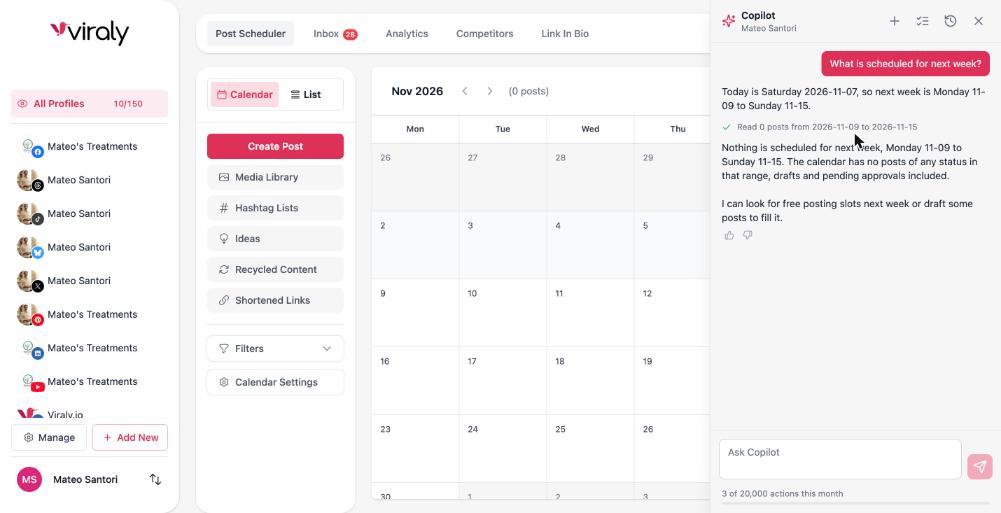
Viraly's assistant is included on every plan and reads the same numbers the analytics pages show. You ask in plain words, and the answer comes back with a line that says what it read.
“What did my best post this week do?”
It names the post, gives its numbers and says which period it read.
“How does this month compare with last month?”
It reads both periods and gives the change for each metric in plain words.
“When did my Instagram posts do best?”
It reads your own posts and names the hours and days that did best for that channel.
A question about your numbers is a read, so no card appears and nothing in your workspace changes. The moment you ask for a change, such as moving a post to the hour that did best, a card shows first, and you confirm, edit or decline it.
Move Thursday's post to 11:00
11:00 is the hour that did best for this channel over the last 30 days. The post keeps its caption and media and moves within the same day.
The same tools in Claude, ChatGPT and Cursor
The analytics tools the assistant uses are also available through Viraly's MCP server, on every plan, under the same rules. Each plan comes with a monthly number of actions, and the meter at the bottom of the panel shows what is left.
Competitors
Compare against competitors
Your own numbers read differently next to the accounts you compete with. Competitor benchmarking comes with Business for 5 competitors, Agency for 15 and Enterprise for 30.
Business
5 competitors
Agency
15 competitors
Enterprise
30 competitors
Switch on the Competitor watch routine and every Monday it reports their top posts, cadence changes, new hashtags and the formats that worked, inside the app. Switch on Competitor ideas as well and it turns what worked for them into idea cards on your board, which you take or leave.
See competitor benchmarking by plan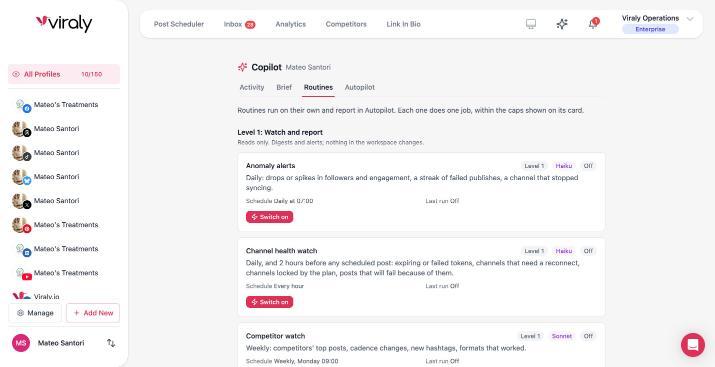
What people ask about a social media analytics tool
Each answer names the plan, the limit or the network rule that applies, so you can check it against the pricing page and the per-network pages above.
What is social media analytics?
Social media analytics is the measurement of how your posts and accounts perform on each network: how many people saw them, how they reacted and how the audience changed over time. A social media analytics tool collects those numbers from the networks, keeps the history and shows them at the post, channel and campaign level.
What can a social media analytics tool help you measure?
It measures reach and views, likes, comments, shares and saves per post, follower growth and the hours that did best per channel, and totals across networks for a campaign. The metrics that matter are the ones tied to your goal: reach for awareness, saves and comments for interest, clicks for traffic, and follower growth for the account.
How do you measure engagement on social media?
Add up a post's likes, comments, shares and saves, divide by followers or reach and multiply by 100 for a rate. Viraly's free engagement rate calculator at viraly.io/tools/engagement-rate-calculator does the math for nine networks, and Viraly's analytics show the counts behind it for every post, with YouTube the exception, since no derived rate is shown there.
How do you track social media analytics across several networks?
Connect each account to one tool that reads them all and compare the same period for each. In Viraly the ten networks sit in one analytics section per social set, campaign analytics add posts across networks together, and once you switch on the Weekly performance digest routine it compares the last 7 days with the 7 before.
Is there a free social media analytics tool?
Yes. Viraly's Free plan includes post, channel and campaign analytics with two weeks of history, and the assistant that answers questions about your numbers. It needs no credit card. CSV exports start on Influencer, PDF reports on Business, and the history grows to six months, twelve months and two years as you move up.
Which Viraly plans include analytics reports?
CSV exports come with Influencer, Business, Agency and Enterprise. PDF reports come with Business, Agency and Enterprise, and on Enterprise the PDF carries your logo, colors and brand name. The Weekly performance digest and Monthly report routines come with Influencer and up, and each one reports inside the app once you switch it on.
How do you present social media analytics to a client?
Show the period against the one before it, name the best and worst posts with a reason each, and end with what changes next month. In Viraly the Monthly report routine, once switched on, writes a narrative per channel and category, the PDF report exports from Business up, and on Enterprise it carries your agency's branding instead of Viraly's.
Does Viraly show an engagement rate for YouTube?
No. Under YouTube's Developer Policies Viraly shows only the figures YouTube itself reports for a channel or video, such as views, watch time, likes, comments and subscribers, and does not calculate an engagement rate or a ranking from them. YouTube also stays out of combined totals across networks, so a campaign total covers the other nine.
What reaches an AI model, and what does not
Prompts carry only the social set you are working in and your brief. Access tokens never enter a prompt. Comments and messages are treated as data, never as instructions. Nothing is used to train models.
Read your numbers in one place.
Start free, connect a channel and the post and channel numbers arrive with the first sync. Open the assistant and ask what your best post did, and from Influencer switch on the weekly digest when you want the words written for you.