Reports come out of the analytics that every plan includes
A social media analytics report that says what happened and what changes next
You have to send a report to a client, a manager or a board, and it has to say what happened, why it happened and what you will do about it. Viraly keeps the numbers for ten networks in one place, exports them as a CSV from Influencer and a PDF from Business, and from Influencer two routines write the weekly and monthly words inside the app.
- CSV exports start on Influencer
- PDF reports start on Business, and Enterprise puts your brand on them
- The weekly digest and monthly report routines start on Influencer and show inside the app
Period
October 2026 against September 2026
- Instagram+212 followers48,200 views (+12%)Engagement 3,140 (+9%)
- LinkedIn+48 followers9,800 views (+4%)Engagement 620 (-3%)
- TikTok+390 followers61,500 views (+18%)Engagement 2,260 (+11%)
Top post
The latte art timelapse, Thursday 15 October
It drew 12,400 views and 410 saves. It was short, it needed no caption and it went out at 11:00.
One change for November
Move the two weekday LinkedIn posts to 8:00
8:00 was the hour that did best for that channel in October, and LinkedIn engagement was the only line that fell.
These are sample numbers in the shape of the one-page monthly social media report this page describes.
The template
What a social media analytics report should contain
A social media report template is the list of questions a reader asks, in the order they ask them. Here is the one-page version, six lines long, with what belongs on each line and how Viraly fills it.
- Line 1 of 6
The period and the one before it
What belongs here
Name the month and the month before it at the top, so every number below reads as a change and not as a total nobody can judge.
How Viraly fills it
Set the period in analytics, and on every plan the assistant answers "October against September" with the change for each metric and the number of posts it counted in each period.
- Line 2 of 6
Reach and engagement per channel
What belongs here
Give one row per channel with its views or reach, its engagement and the change, because the reader wants to know where the audience was and not only how big it was.
How Viraly fills it
Channel analytics show each account's views, likes, comments, shares and saves where the network reports them, and from Influencer the CSV export carries those columns for one channel at a time.
- Line 3 of 6
The follower change
What belongs here
Put the follower count at the end of the period next to the change since the last report, per channel, and say which post or which week moved it when you can.
How Viraly fills it
Channel analytics report followers per channel, and Facebook and Instagram add a daily series of follows and unfollows that reaches back as far as your plan keeps.
- Line 4 of 6
The top and the worst post, with why
What belongs here
Name both posts, show their numbers and write one line on what made the difference, because the reader will recall the posts and forget the averages.
How Viraly fills it
The top posts list ranks any period you pick, and from Influencer the Weekly performance digest routine, once switched on, names the top and worst posts with one suggestion each.
- Line 5 of 6
The campaign totals
What belongs here
Add up the posts of one campaign across networks, so a launch gets one line and one verdict instead of a tab per network.
How Viraly fills it
Campaign analytics add the posts from one campaign across networks into one total on every plan, and YouTube's numbers sit on their own line, because YouTube's Developer Policies keep them out of a combined total.
- Line 6 of 6
One decision for next month
What belongs here
End with one change: a posting time, a format to repeat, a channel to rest or a topic to drop. One decision gets a yes, and a list of five gets filed.
How Viraly fills it
The weekly digest gives one suggestion per post it names, and from Influencer the Monthly report routine writes a narrative per channel and per category inside the app. You pick the decision and write it in.
An optional competitor line
On Business, Agency and Enterprise, competitor benchmarking puts 5, 15 or 30 competitors beside your numbers, so the reader can see whether a flat month was yours alone or the whole category's.
The numbers behind the template
That is the whole social media report template. The analytics page explains the three levels, the history by plan and what each of the ten networks reports, so this page stays with the report itself.
See the analytics toolThe steps
How to create a social media report in Viraly, in four steps
Here's how it works: the numbers are already in the app, so creating the report means choosing the period, reading the three levels, exporting in the form your plan includes and writing the one decision yourself.
- Step 1Every plan
Pick the social set and the period
Open the social set the report is about, one per brand or client, and set the period in analytics. The date picker offers the history your plan keeps: two weeks on Free, six months on Influencer, twelve months on Business and two years on Agency and Enterprise, so a month against the same month last year needs Business or above.
- Step 2Every plan
Read the three levels
Read the post level for the top and worst posts, the channel level for views and followers, and the campaign level for the launch total. All three come with every plan, Free included, and the assistant answers "what did my best post do" on every plan, so you do not have to scan the list.
See what each network reports - Step 3CSV from Influencer, PDF from Business
Export the CSV or the PDF
From Influencer, export the analytics as a CSV, one channel per file with the metric columns you pick, and open it in your spreadsheet. From Business, export the PDF analytics report with the numbers and the period and send it as it is. On Enterprise the PDF carries your logo, colors and brand name.
- Step 4Your part
Add the one decision
Write the one change for next month yourself, from the numbers above and, from Influencer, from the suggestions in the weekly digest and the narrative in the Monthly report routine. The report is finished when a reader can say yes or no to its last line.
A report about posts that someone else approved reads better with the approval trail beside it, and the approvals page shows how that trail is kept on each post.
Three ways out
Three ways out: CSV, PDF, white label PDF
Social media reporting software is judged at the export, where the numbers leave the app in a form the reader will open. Viraly has three exports, and your plan decides which ones you see.
CSV export
The CSV carries one channel's posts for the period: the date, the content, the post link and the metric columns you picked from that network's list. Open it in Excel or Google Sheets and build the chart your reader is used to, or paste the rows into the template your agency already uses.
Through the MCP server the same export comes back as CSV text, up to 100 rows per call, so Claude or ChatGPT can read the rows. It needs Influencer, like the export in the app.
PDF analytics report
The PDF carries the numbers and the period, so a manager or a board reads it without a deck being built around it. It is made in the app: the assistant answers questions about the numbers, and it does not produce files.
White label PDF
The same PDF carries your logo, your colors and your brand name instead of Viraly's, so the client sees your agency's name on the cover and not the tool's. The white label page covers the rest: the app, the emails it sends and the sign-in domain.
The pricing page has the five plans side by side, and the rest of what an agency puts its own name on, from the app to the sign-in domain, is on the white label page.
The routines
The routines that write the words
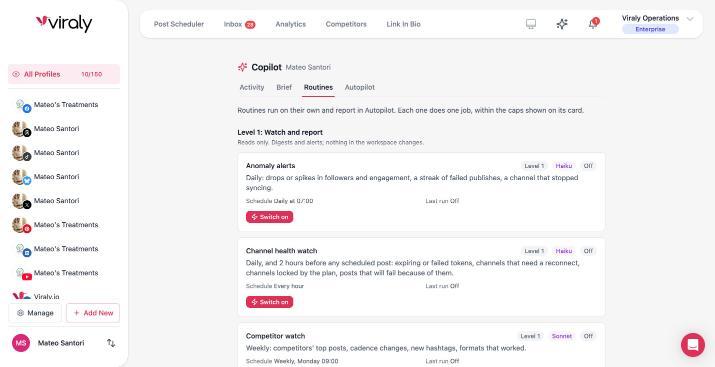
Automated social media reports in Viraly are two Level 1 routines, off until you switch them on in a social set from Influencer. Each one reads the numbers and writes the words, and nothing in the workspace changes.
Switch it on in a social set and each Monday the digest is waiting: the last 7 days beside the 7 before, the top post and the worst post named, and one suggestion under each. It reads only, so the workspace is exactly as you left it.
Switch it on and the first of the month brings last month's analytics export with a short narrative per channel and per category, written for that social set alone, so one client's report never mixes with another's.
Neither routine sends an email. Both report inside the app, in the assistant's section and the notification bell, so you read the words first and decide what the client sees. The Free plan shows the numbers and answers questions, and the routines start on Influencer.
The assistant
Ask instead of building
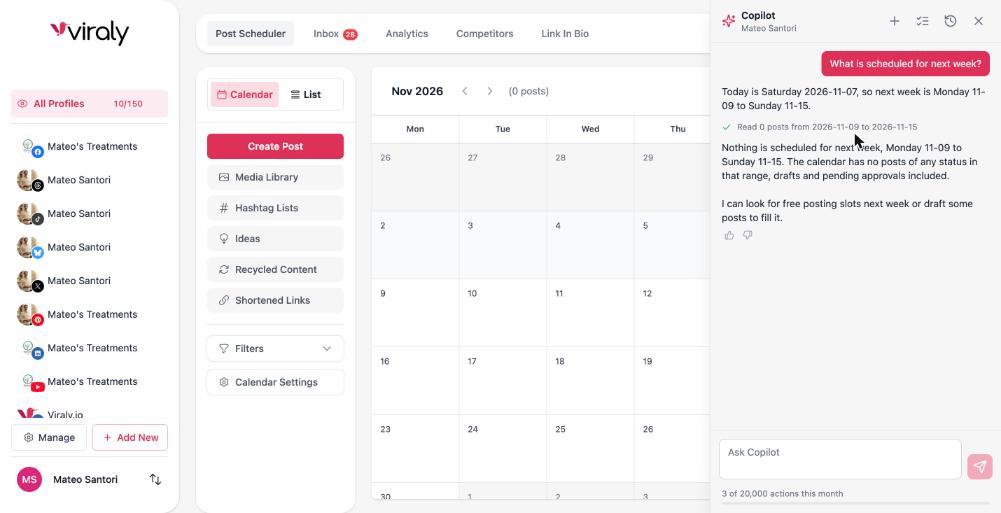
A question about your numbers is a read, so the assistant answers it on every plan, Free too, and prints the line that says what it read. The changes it can make, such as moving a post to a better hour, start on Influencer and show a card first.
Ask 1
“What did my best post in October do?”
It ranks the posts of that period, names the one at the top with its views, likes, comments, shares and saves, and prints the line that says how many posts and which dates it read.
Ask 2
“Compare October with September for the Instagram channel.”
It reads both periods and gives the change for each metric in plain words, with the number of posts it counted in each, so the sentence can go into the report as it is.
The same questions work from Claude, ChatGPT or Cursor through the MCP server, on every plan, within the same plan limits. Reads run at once, and over MCP there is no Viraly card, so your AI client is the one that asks before anything changes.
What people ask about social media reports
Each answer names the plan that includes the export or the routine it mentions, so you can check it against the pricing page before you promise a client anything.
What is a social media analytics report?
A social media analytics report compares one period with the one before it and says what changed and why. It carries reach and engagement per channel, the follower change, the top and worst posts and one decision for the next period. Viraly exports the numbers as CSV or PDF, and from Influencer two routines write the words.
What should a monthly social media report include?
Include the month and the month before it, views or reach and engagement per channel, the follower change, the top and worst post with a reason each, the campaign totals and one decision for next month, on one page. Viraly's analytics hold those numbers, and from Influencer the Monthly report routine writes the narrative inside the app.
How often should you report on social media?
Report monthly to a client, a manager or a board, and read a weekly digest so a drop shows up before the month ends. A week moves with one post, so the decisions belong in the monthly report. Viraly's Weekly performance digest and Monthly report routines keep that rhythm once you switch them on from Influencer, inside the app.
Can Viraly generate a social media report automatically?
Yes, from Influencer. Switch on the Monthly report routine and on the first of the month it writes the analytics export plus a narrative per channel and per category for last month, inside the app. The Weekly performance digest does the same every Monday for the last 7 days against the 7 before. Neither one is emailed.
Is there a free social media report tool?
Yes, for the numbers. Viraly's Free plan shows post, channel and campaign analytics with two weeks of history and the assistant answers questions about them, with no credit card. The exports start higher up: the CSV on Influencer and the PDF report on Business. The engagement rate calculator on viraly.io is free as well and needs no account.
Can the report carry my agency's branding?
Yes, on Enterprise. The white label PDF carries your logo, colors and brand name instead of Viraly's, so a client reads a report from your agency. PDF analytics reports without your branding start on Business, and CSV exports on Influencer. The white label page lists the rest: the app, the emails it sends and the sign-in domain.
How do you write a social media analytics report?
Write every number as a change against the period before, one row per channel, and say in one line why the top and the worst post did what they did. End with one decision the reader can agree to. From Influencer, Viraly's weekly digest adds a suggestion for the top and the worst post, inside the app.
What reaches an AI model, and what does not
Prompts carry only the social set you are working in and your brief. Access tokens never enter a prompt. Comments and messages are treated as data, never as instructions. Nothing is used to train models.
Send the report with the numbers already in it.
Start free, connect a channel and read the three levels for the period you report on. From Influencer the CSV export and the weekly digest are there, and from Business the PDF goes to the reader as it is.